Overview
The Reports section gives you structured analytics across three dedicated pages: a summary dashboard, a detailed revenue report, and a client analytics report. You can filter every view by date range using quick presets or a custom range. When you need to share or process the data outside the application, you can export reports as CSV (for spreadsheets) or PDF (for sharing).
Prerequisites
- Role required: Admin or Manager
- Before you start: Ensure appointments and payments have been recorded in the system so the reports have data to display
Navigate to the Reports Dashboard
Click Reports in the sidebar navigation, or go to /reports directly.
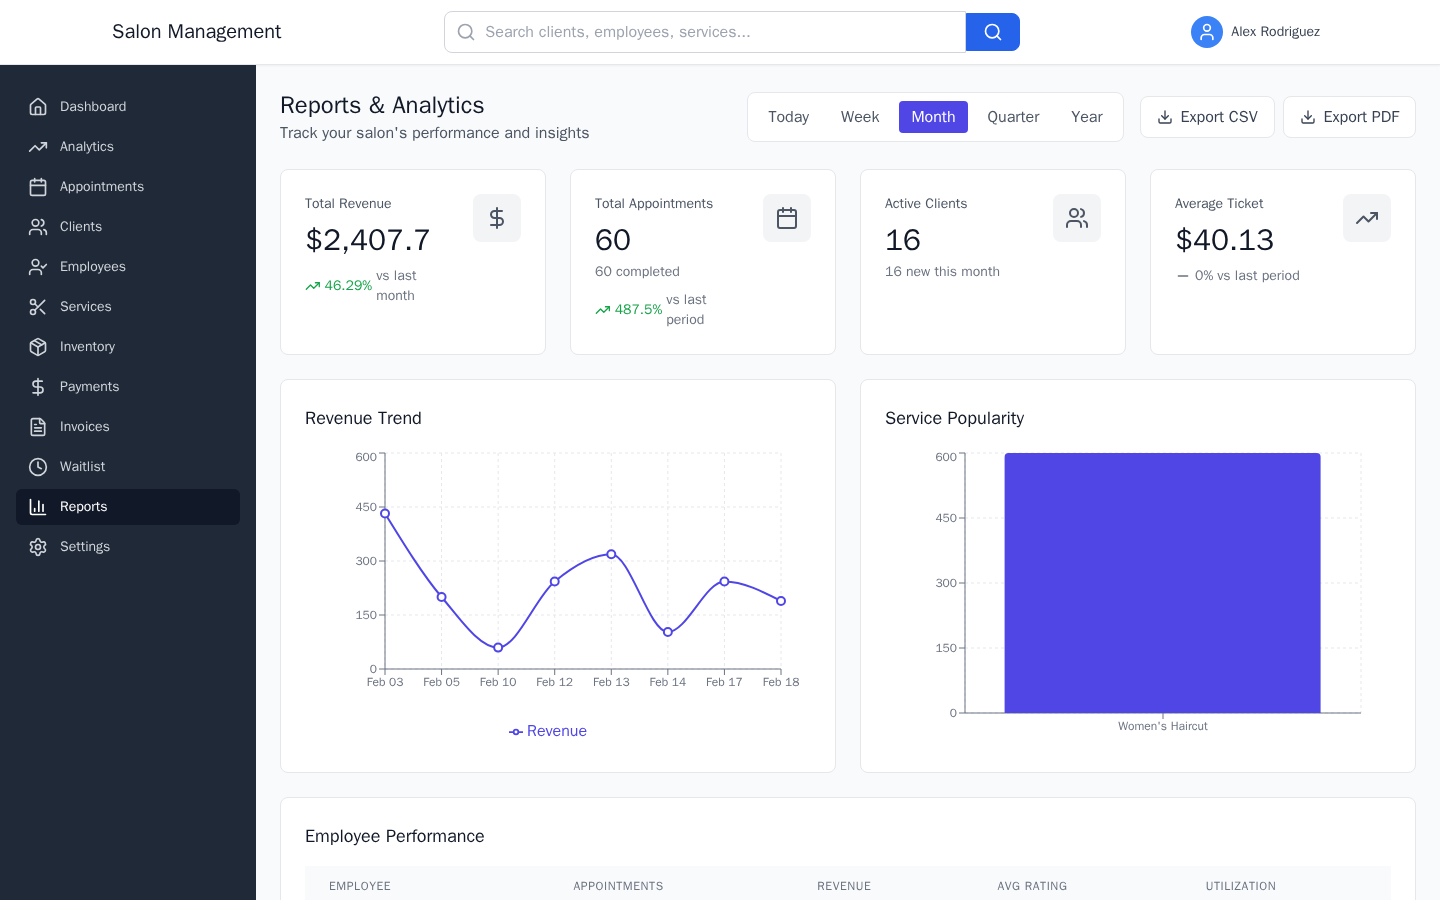
What you'll see: The "Reports & Analytics" page with the heading "Track your salon's performance and insights." At the top right you will find the date range controls and export buttons.
Select a date range
Choose a preset from the date range bar at the top right of the page:
| Preset | What it covers |
|---|---|
| today | The current calendar day |
| week | The last 7 days |
| month | The current calendar month (default) |
| quarter | The last 90 days |
| year | The last 365 days |
Click a preset to highlight it in indigo; all metrics and charts on the page update immediately to reflect the selected range. If you need a custom range that does not match a preset, you can pass start and end dates through the URL parameters (advanced use).
Review the four metric cards
Below the header, four summary cards show high-level numbers for the selected date range:
- Total Revenue -- total income, with a percentage change vs. last month
- Total Appointments -- booking count, with the number completed shown as a subtitle
- Active Clients -- total client count, with the number of new clients this month
- Average Ticket -- mean revenue per appointment, with a change percentage
Each card shows a loading spinner while data is being fetched. If a card fails to load, an error banner appears at the top of the page: "Failed to load some report data. Please try again."
Read the Revenue Trend chart
The Revenue Trend line chart plots revenue over time for the selected date range. The x-axis shows dates and the y-axis shows revenue in dollars. Use this chart to spot seasonal patterns, day-of-week spikes, or unexpected drops.
To the right of the Revenue Trend is the Service Popularity bar chart, which ranks services by revenue generated in the selected period. The x-axis shows service names and the bars show the revenue each service produced.
Review the Employee Performance table
Below the charts is the Employee Performance table. Columns are:
- Employee -- the staff member's name
- Appointments -- number of appointments they completed
- Revenue -- total revenue they generated
- Avg Rating -- their average star rating from client feedback
- Utilization -- a progress bar showing the percentage of available hours they were booked
The table scrolls horizontally if the viewport is narrow. Rows are clickable when more employee detail is needed.
Access detailed sub-reports
At the bottom of the Reports Dashboard are three shortcut cards:
- Revenue Report -- click to go to
/reports/revenuefor a deeper breakdown of revenue trends, service categories, and client segment analysis - Client Analytics -- click to go to
/reports/clientsfor client acquisition, retention, lifetime value, and growth trend data - Service Analytics -- service performance and popularity data is available on the main Reports Dashboard via the Service Popularity chart
Each sub-report page follows the same layout: metric cards at the top, charts below, and the same date range presets in the header.
Export your data
Two export buttons are available at the top right of the Reports Dashboard, next to the date range controls:
- Export CSV -- downloads the revenue data for the selected date range as a
.csvfile namedrevenue-report. Open it in Excel, Google Sheets, or any spreadsheet application. - Export PDF -- generates a PDF document containing all dashboard data (revenue, service popularity, and employee performance). The file is named "Reports Dashboard."
Use the Data Export API for bulk data (optional)
For bulk data extracts beyond what the Reports Dashboard provides, use the export endpoints at /api/export/. This is primarily for integrations or one-time data pulls.
- Supported entity types: clients, employees, services, products
- Supported formats: CSV, JSON
- Date range filtering: supported for all entity types
- Access: Admin and Manager only; these endpoints are rate-limited because they can be resource-intensive
To use the export API, make a request to the appropriate endpoint with your date range and format parameters. Contact your Admin if you need API credentials or documentation on request parameters.
Tips & Best Practices
/reports/clients) when preparing for a marketing campaign -- the retention and lifetime value data shows which segments are most valuable.
Common Issues
| Issue | Solution |
|---|---|
| Charts show empty / "No data" | The selected date range may have no recorded appointments; try switching to "month" to confirm data exists |
| "Failed to load some report data" error banner | One or more API calls failed; wait a moment and refresh the page, or check your network connection |
| "Export CSV" button does nothing | No revenue data exists for the selected period; select a range that includes completed appointments |
| Employee Performance table is blank | No employees have completed appointments in the selected range; switch to a broader date range |
| PDF export includes partial data | The PDF captures data that has already loaded; wait for all sections to finish loading before clicking "Export PDF" |
Related Journeys
- Daily Dashboard Walkthrough -- Overview of real-time metrics shown on the main dashboard
- Adding an Employee -- Ensure staff records are set up so performance data appears correctly in reports