Overview
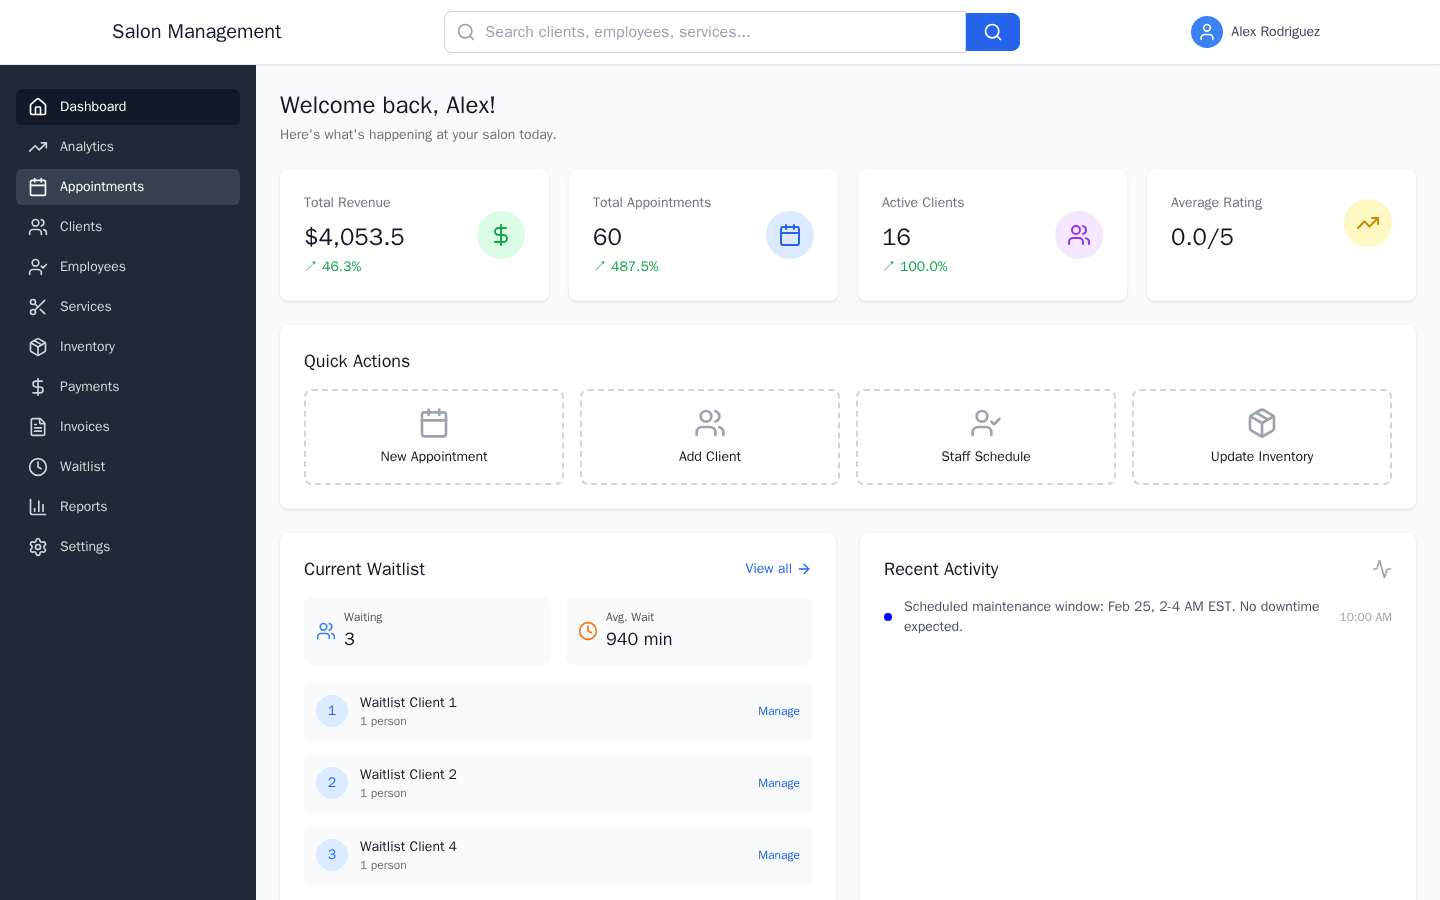
The dashboard is the first page you see after logging in. It pulls together real-time data from across the system -- appointments, revenue, client activity, staff performance, and customer feedback -- so you can understand what is happening right now without digging through individual reports. Use it at the start of each day, and revisit it throughout the day to stay on top of activity.
Prerequisites
- Role required: Admin or Manager (full dashboard access); other roles see a limited view
- Before you start: No setup needed -- the dashboard loads automatically after login
Log in and land on the dashboard
Navigate to the application and log in. The system redirects you to / (the dashboard) automatically.
What you'll see: A welcome message -- "Welcome back, [First Name]!" -- followed by the main dashboard grid. If data is still loading, you will see a spinner in the center of the page. If any section fails to load, a "Retry" button appears so you can reload without refreshing the whole page.
Review the top-level metrics
The first section below the welcome message is the Metrics Widget -- a row of four stat cards.
| Card | What it shows |
|---|---|
| Total Revenue | Cumulative revenue for the current period, with a percentage change indicator (green arrow = growth, red arrow = decline) |
| Total Appointments | Total appointment count for the period, with a growth percentage |
| Active Clients | Number of currently active clients, with a growth percentage |
| Average Rating | Salon's average review score out of 5, with a change indicator |
Each card shows the current value in large text plus a small percentage trend arrow. A green upward arrow means the metric is improving; a red downward arrow means it has declined.
Use Quick Actions for common tasks
Below the metrics is the Quick Actions panel. It contains four shortcut buttons:
- New Appointment -- navigates to
/appointments/new - Add Client -- navigates to
/clients/new - Staff Schedule -- navigates to
/employees(view staff schedules and availability) - Update Inventory -- navigates to
/inventory
Click any of these to jump directly to that workflow without using the sidebar navigation.
Check the Waitlist and Recent Activity
The next row is a two-column grid:
- Waitlist Widget (left): Shows clients currently on the waitlist, sorted by priority. Useful for spotting open slots you can fill quickly.
- Recent Activity (right): A live feed of events such as new bookings, cancellations, and client check-ins, each with a timestamp. If there has been no activity today, the panel shows "No recent activity."
Read the Customer Feedback summary
The Customer Feedback widget shows aggregated feedback data:
- Average Rating -- the salon's mean star rating out of 5
- Total Reviews -- count of all feedback entries
- NPS Score -- Net Promoter Score (numerical value)
- NPS Status -- a label: "Excellent" (NPS >= 50), "Good" (NPS >= 0), or "Needs Improvement" (NPS < 0)
- NPS Distribution -- a breakdown showing the count of Promoters, Passives, and Detractors
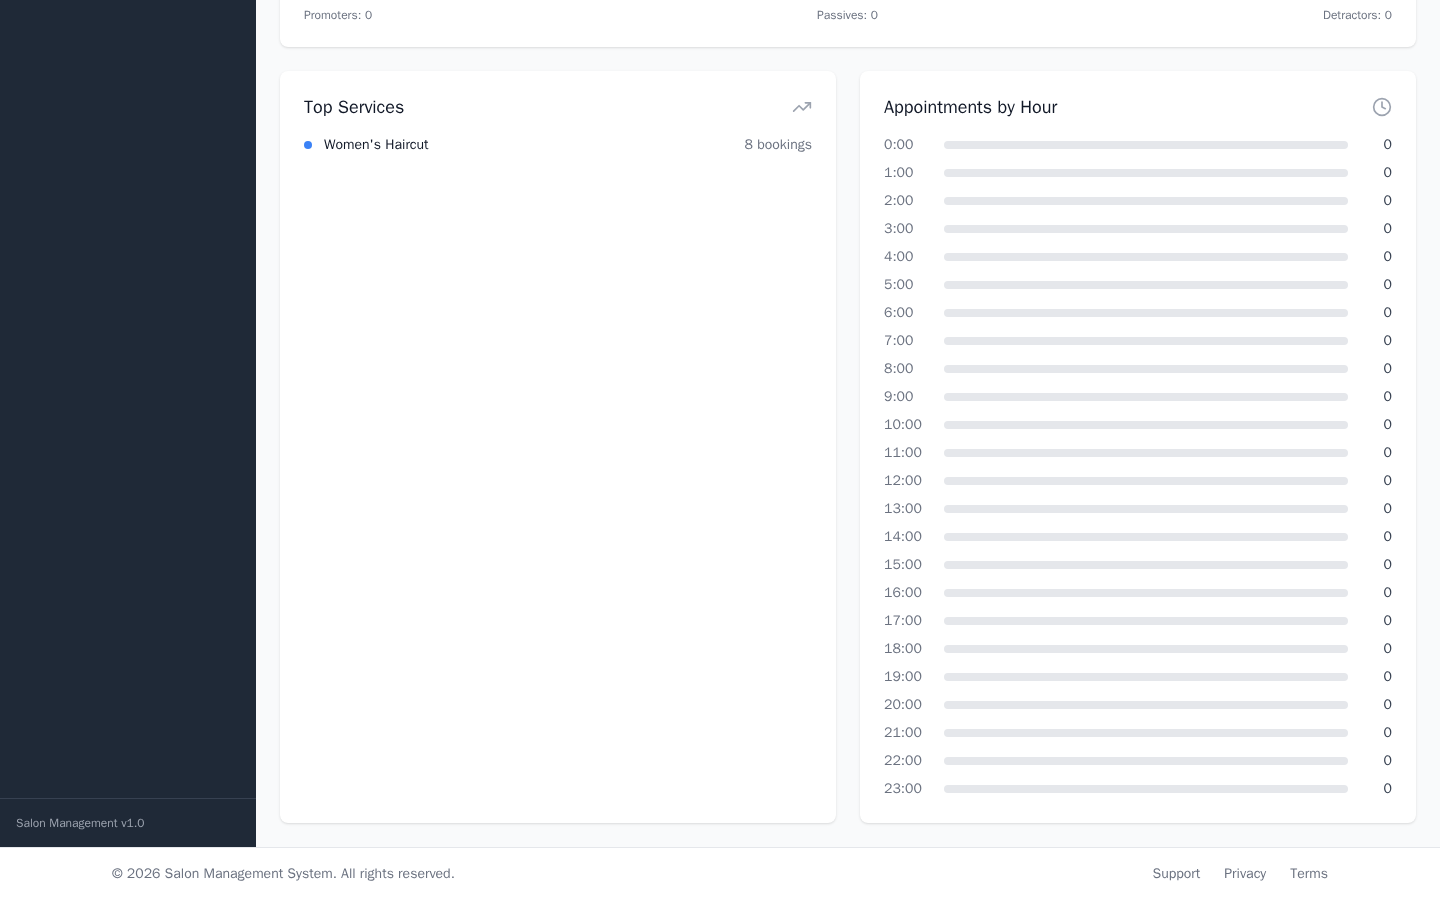
Review Top Services and Appointments by Hour
The next grid shows two analytical panels side by side:
- Top Services (left): Ranks up to five services by booking count. Each row shows the service name and how many bookings it received.
- Appointments by Hour (right): A horizontal bar chart showing booking volume for each hour of the day (e.g., "9:00 -- 6"). Use this to identify peak times and plan staffing accordingly.
Review advanced analytics widgets (Admin/Manager)
If your role is Admin or Manager, additional widgets are available on the analytics dashboard at /dashboard (or the AnalyticsDashboard view):
ROVI Metrics Card -- Tracks five provider-level performance dimensions:
- Clients Served
- Average Ticket Value ($)
- Rebooking Rate (%)
- Panel Utilization (%)
- Cross-Service Score (%)
An Overall ROVI Score is calculated and shown with a performance rating (Excellent / Good / Fair / Needs Improvement). You can switch the timeframe (Week / Month / Quarter / Year) using the dropdown at the top of the card.
Salon Health Overview -- A composite health score made of four weighted components:
| Component | Weight |
|---|---|
| Financial Health | 30% |
| Operational Health | 25% |
| Customer Satisfaction | 25% |
| Staff Performance | 20% |
The overall score is displayed as a large number with a status label (Excellent / Very Good / Good / Fair / Needs Improvement / Poor / Critical). Progress bars for each component are shown below the score. You can expand a "View Details" section for a breakdown of sub-metrics and their statuses. Active alerts (warnings, info notices) appear with a dismiss button so you can clear them once addressed.
Leaderboard Widget -- Ranks providers across four categories:
- Revenue
- Clients
- Rebooking Rate
- Efficiency
Use the "Category" and "Timeframe" dropdowns to switch views. The top three positions are highlighted with gold, silver, and bronze styling. Click on any entry to view that provider's detail page. If you are a provider yourself, your rank is shown at the bottom of the list if you are not in the top five.
Achievement Notifications -- Shows recent achievement unlocks for staff members (e.g., "First 100 clients served"). Achievements are calculated nightly at 2:00 AM by the scheduler.
Tips & Best Practices
Common Issues
| Issue | Solution |
|---|---|
| Dashboard shows a spinner and never loads | Check your internet connection, then click the "Retry" button that appears after the timeout |
| NPS Status shows "N/A" | No feedback has been collected yet; encourage clients to leave reviews after appointments |
| Health Score shows "Data may be outdated" | Click the refresh icon on the Salon Health Overview widget to trigger a recalculation |
| Leaderboard shows "No leaderboard data available" | No provider performance data exists for the selected timeframe; try switching to "This Month" |
| Achievement Notifications are empty | Achievements are processed at 2:00 AM daily; check back after the next overnight run |
Related Journeys
- Running Reports & Exporting Data -- Drill deeper into the metrics shown on the dashboard
- First Login and Setup -- Initial configuration steps before using the dashboard