Overview
When your organization operates multiple salon locations, you need a way to see the big picture without logging into each salon individually. The Organization Dashboard provides aggregate summary cards and a per-location breakdown table. Combined with the SalonSwitcher, you can seamlessly move between an all-locations overview and detailed single-salon reports. This guide walks you through accessing cross-location analytics, reading the aggregate metrics, comparing locations, and exporting the data.
Prerequisites
- Role required: Organization Owner, Organization Admin, or System Admin
- Before you start: Your organization must have at least two salon locations with recorded appointments and transactions so that comparison data is meaningful
Access the Organization Dashboard
Navigate to the Organization Dashboard from the sidebar or by going to the organization overview page directly. This page is only visible to users with organization-level or system-level access scope.
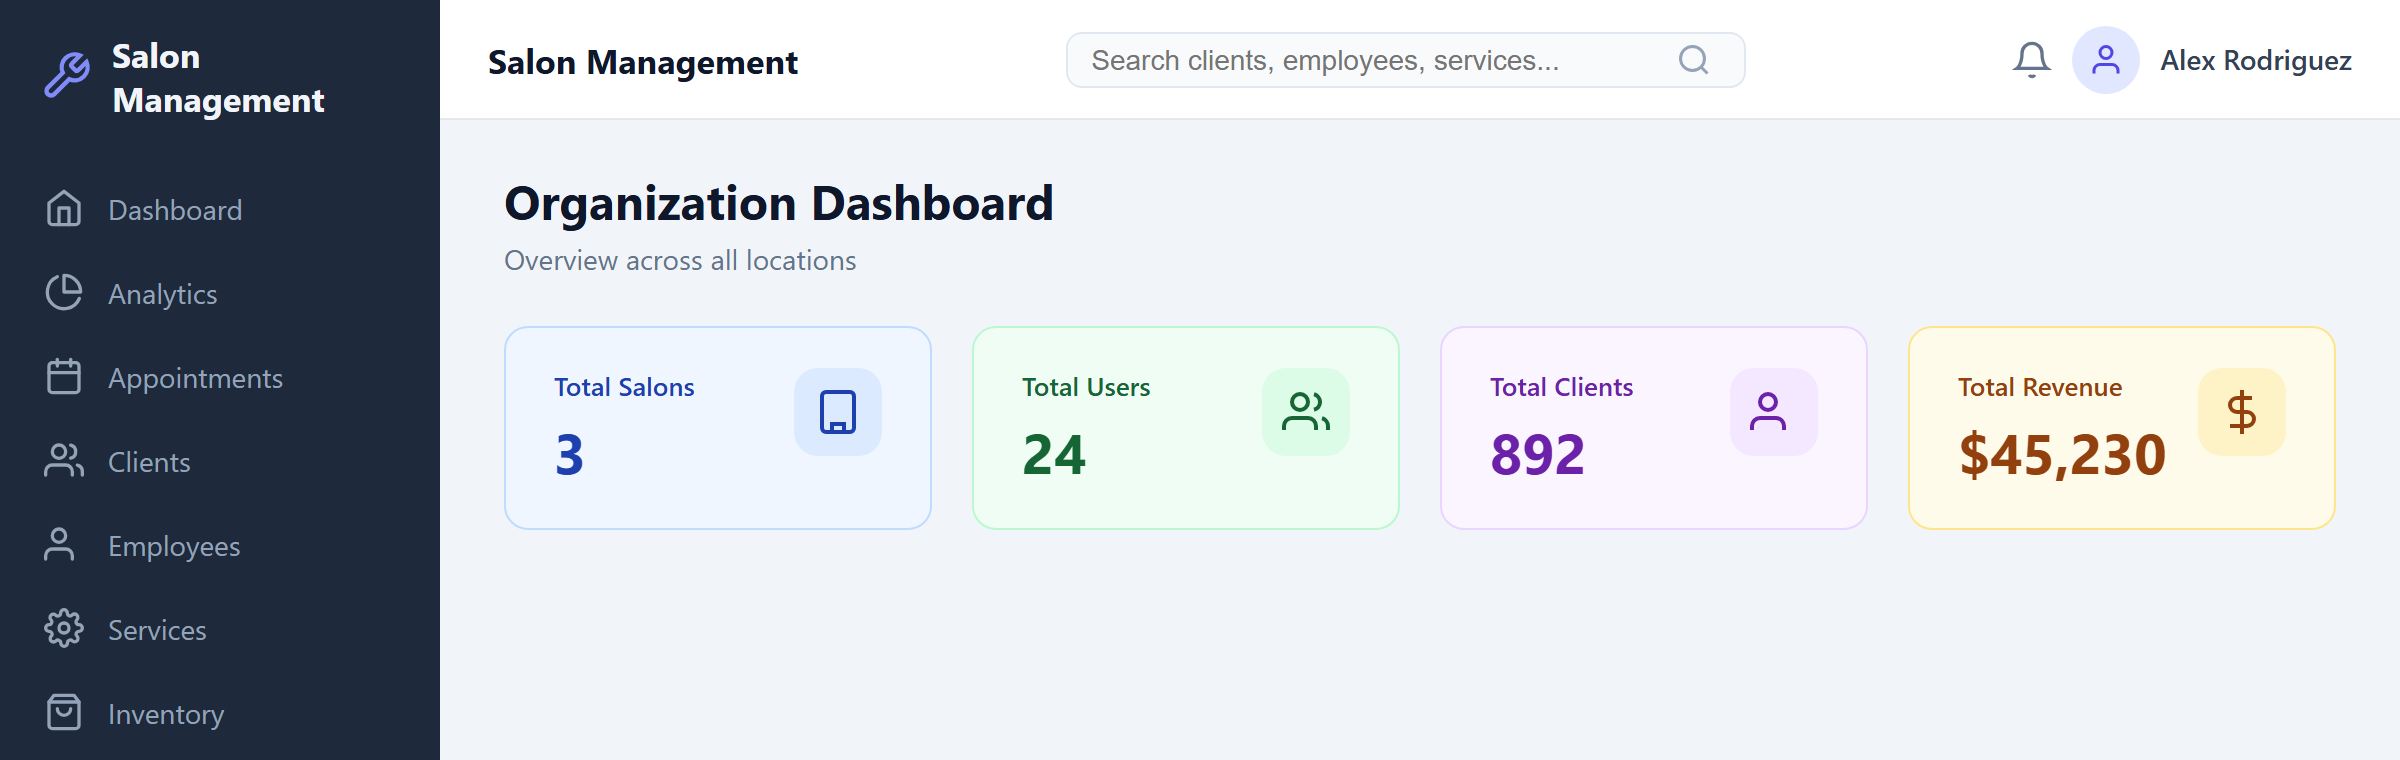
What you'll see: The page heading "Organization Dashboard" with the subtitle "Overview across all locations." Below the heading are four color-coded summary cards followed by a per-location breakdown table.
Read the Aggregate Summary Cards
The top section of the Organization Dashboard displays four summary cards that aggregate data across every salon in your organization:
| Card | Color | What it shows |
|---|---|---|
| Total Salons | Blue | The number of salon locations in your organization |
| Total Users | Green | The total number of staff user accounts across all locations |
| Total Clients | Purple | The combined client count across all salons |
| Total Revenue | Yellow | The total revenue across all locations, formatted as $X,XXX |
Each card displays an icon on the left (Building, Users, User Check, Dollar Sign) with the label and value to the right. While data is loading, a spinner is shown in place of the cards. If the data fails to load, a red error banner appears with the specific error message.
Compare Per-Location Performance
Below the summary cards is the Per-Location Breakdown table. This table lets you compare how each salon is performing relative to the others.
| Column | Description |
|---|---|
| Salon | The name of the salon location |
| Clients | The number of clients registered at that location |
| Appointments | The total number of appointments at that location |
| Revenue | The total revenue generated, formatted as $X,XXX |
Scan the table to identify your highest-performing location, spot locations that may need attention, or verify that a new location is ramping up as expected. The table scrolls horizontally on smaller screens. If no salon data is available, the table displays a centered message: "No salon data available."

Switch to a Single-Salon View Using SalonSwitcher
The SalonSwitcher dropdown is located in the application header. It appears as a select menu with a building icon and is only visible to users with organization-level or system-level access.
To focus on a single location:
- Click the SalonSwitcher dropdown in the header.
- You will see All Locations at the top, followed by the name of each salon in your organization.
- Select the specific salon you want to drill into.
Once you select a salon, the entire application context switches to that location. All pages -- including Reports, Appointments, Clients, and other sections -- will show data only for the selected salon.
To return to the aggregate view, open the SalonSwitcher dropdown and select All Locations. This clears the salon selection and restores the cross-location context.
Use Standard Reports in Salon Context
After selecting a specific salon in the SalonSwitcher, navigate to Reports in the sidebar (or go to /reports directly). The Reports page respects the currently selected salon context.
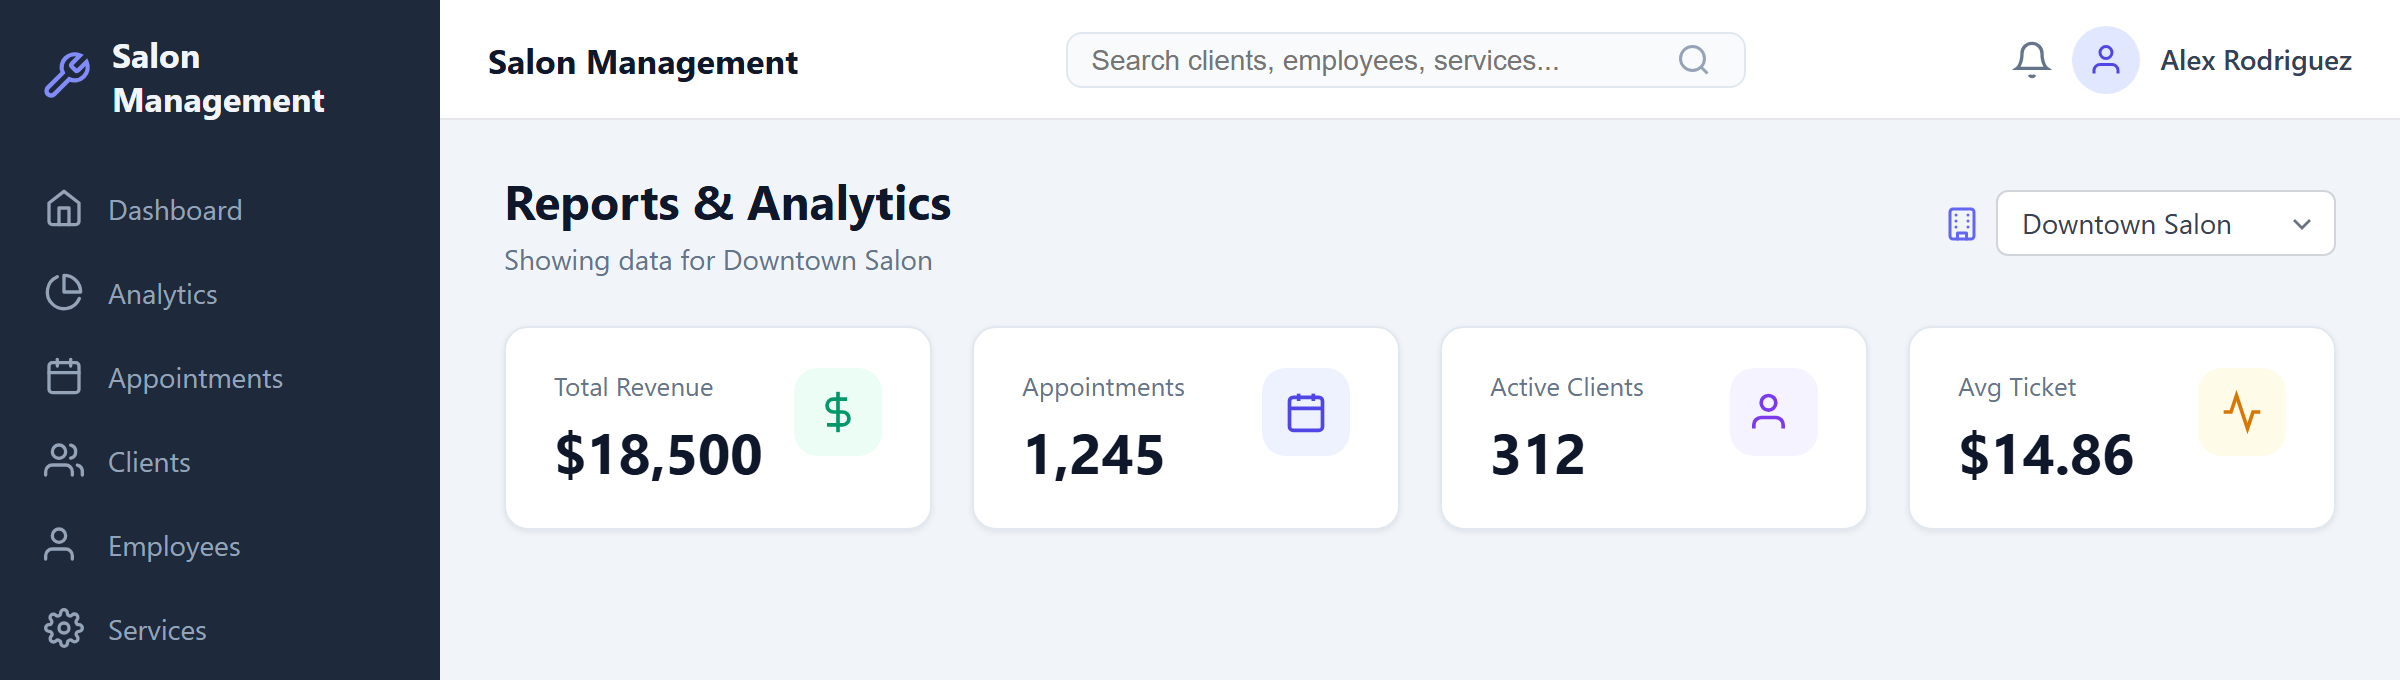
In single-salon mode: The Reports & Analytics page displays four metric cards (Total Revenue, Total Appointments, Active Clients, Average Ticket), the Revenue Trend chart, Service Popularity chart, and the Employee Performance table -- all filtered to the selected salon's data only.
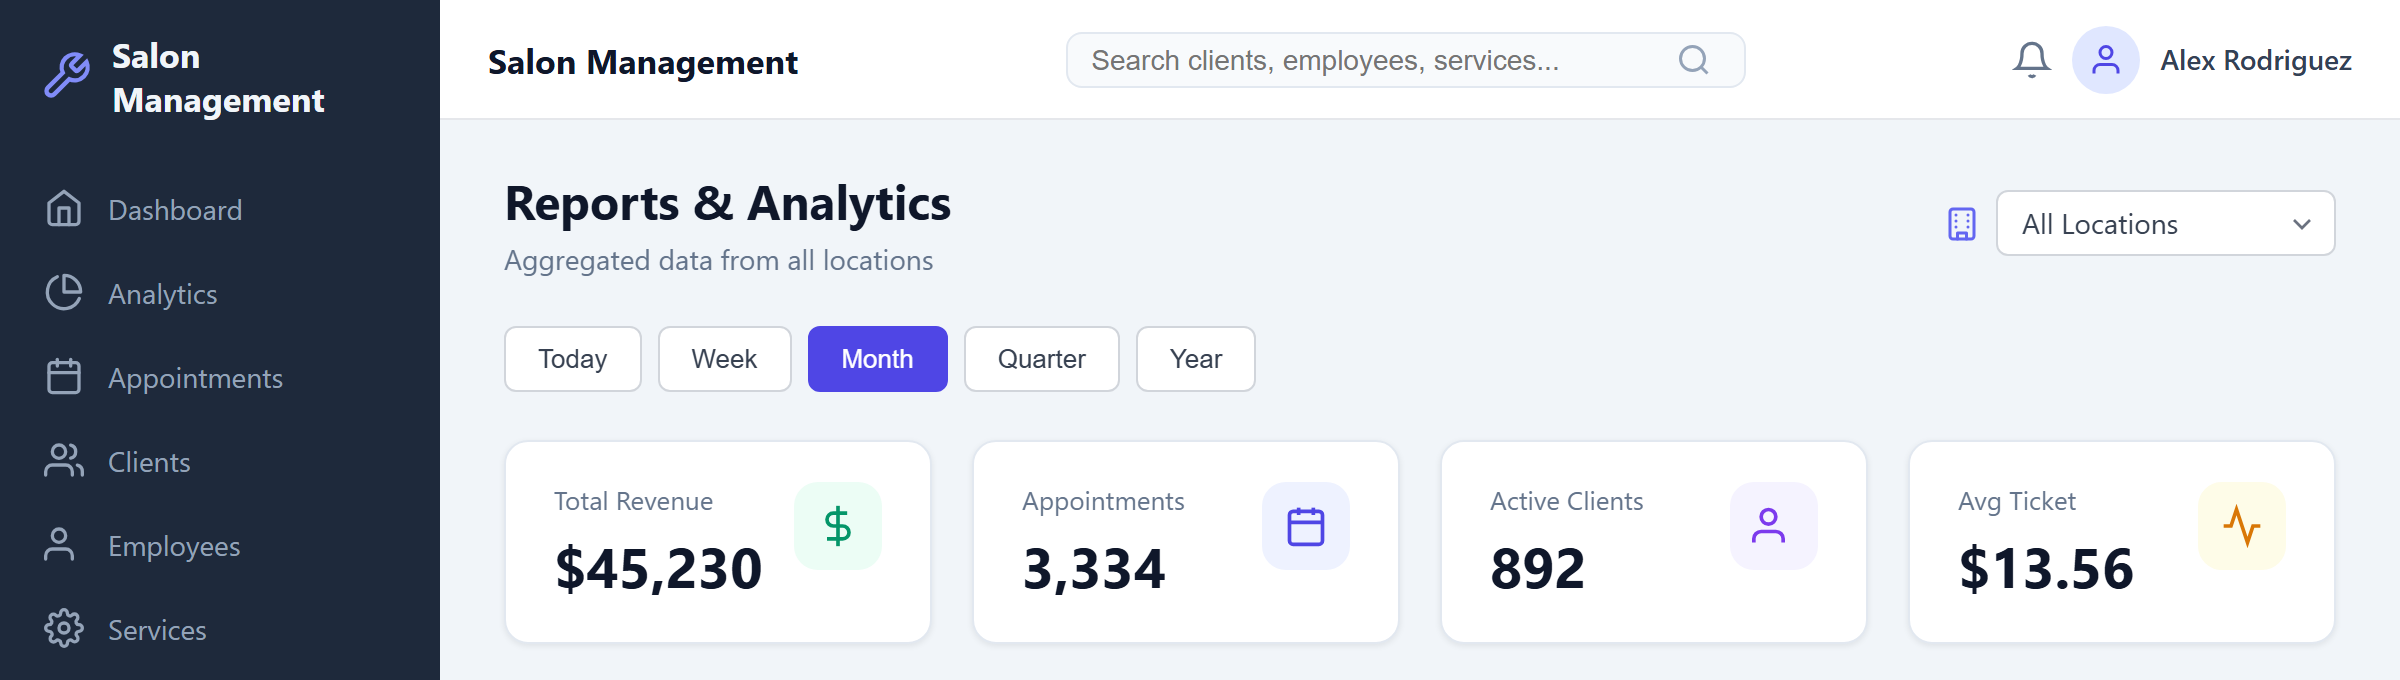
In All Locations mode: The same Reports page displays metrics aggregated across all salons in the organization. Use the date range presets (today, week, month, quarter, year) to adjust the time window.
Export Cross-Location Data
To export report data, navigate to the Reports page (with whatever salon context you need) and use the export buttons at the top right of the page:
- Export CSV -- Downloads revenue data for the current context (all locations or a single salon) as a
.csvfile. Open it in Excel, Google Sheets, or any spreadsheet application. - Export PDF -- Generates a PDF document containing the dashboard data (revenue, service popularity, employee performance) for the current context.
Tips & Best Practices
- Start each week on the Organization Dashboard to get a quick pulse on all locations before diving into individual salon details.
- Use the Per-Location Breakdown table to identify underperforming locations early. A salon with low appointment counts relative to its client base may have scheduling issues.
- When comparing locations, keep in mind that newer salons will naturally have lower totals. Focus on growth trends in the standard Reports view rather than raw numbers alone.
- Export CSV data in "All Locations" mode at month-end for consolidated financial reporting across your organization.
- The SalonSwitcher selection persists across page navigations within the same browser session, so you do not need to re-select a salon each time you switch pages.
- If you manage salons across different time zones, remember that revenue and appointment data is based on each salon's local time.
Common Issues
| Issue | Solution |
|---|---|
| Organization Dashboard shows "No report data available" | The API call may have failed. Refresh the page. If the problem persists, verify that your account has organization-level access. |
| Per-Location Breakdown table shows "No salon data available" | No salons have been registered under your organization yet. Contact your system administrator to add salon locations. |
| SalonSwitcher is not visible in the header | Your account has salon-scope access only. The SalonSwitcher only appears for Organization Owner, Organization Admin, and System Admin roles. |
| Reports page shows data for all locations when I selected a specific salon | The salon switch may not have completed. Click the SalonSwitcher again and verify the correct salon name is selected. Try refreshing the page. |
| Revenue figures on Organization Dashboard do not match the Reports page | The Organization Dashboard shows lifetime totals, while the Reports page respects the selected date range. Set the Reports date range to "year" or broader for a closer comparison. |
| Export CSV is empty or has no rows | No revenue data exists for the selected context and date range. Switch to a broader date range or verify that the selected salon has completed appointments. |
Related Journeys
- Running Reports & Exporting Data — Detailed guide to the Reports page, date range presets, charts, and export options
- Daily Dashboard Walkthrough — Overview of the single-salon dashboard widgets and daily metrics
- Switching Between Salon Locations — How to use the SalonSwitcher to change your active salon context
- Managing Your Organization — Setting up and administering your multi-location organization